import numpy as np; import matplotlib.pyplot as plt
import EOBRun_module
pars = {
# System parametes, assuming aligned spins
'M' : 1, # Total mass
'q' : 2, # Mass ratio m1/m2 > 1
'chi1' : 0., # Z component of chi_1
'chi2' : 0., # Z component of chi_2
'LambdaAl2' : 0., # Quadrupolar tidal parameter of body 1 (A)
'LambdaBl2' : 0., # Quadrupolar tidal parameter of body 2 (B)
'ecc' : 0.3, # Eccentricity. Default = 0.
'ecc_freq' : 2, # Use periastron (0), average (1) or apastron (2) frequency for initial condition computation. Default = 1
# Initial conditions and output time grid
'domain' : 0, # Time domain. EOBSPA is not available for eccentric waveforms!
'srate_interp' : 4096., # srate at which to interpolate. Default = 4096.
'use_geometric_units': "yes", # output quantities in geometric units. Default = 1
'initial_frequency' : 0.003, # in Hz if use_geometric_units = 0, else in geometric units
'interp_uniform_grid': "yes", # interpolate mode by mode on a uniform grid. Default = 0 (no interpolation)
# Modes
'use_mode_lm' : [1], # List of modes to use/output through EOBRunPy
# Output parameters (Python)
'arg_out' : "yes", # Output hlm/hflm. Default = 0
}
t, hp, hc, hlm, dyn = EOB.EOBRunPy(pars)
pks = find_peaks(dyn['MOmega'], distance=150) [0]
nu = pars['q']/(1 + pars['q'])**2
Eb = (dyn['E'] - 1.)/nu
# Plot
fig, ax = plt.subplots()
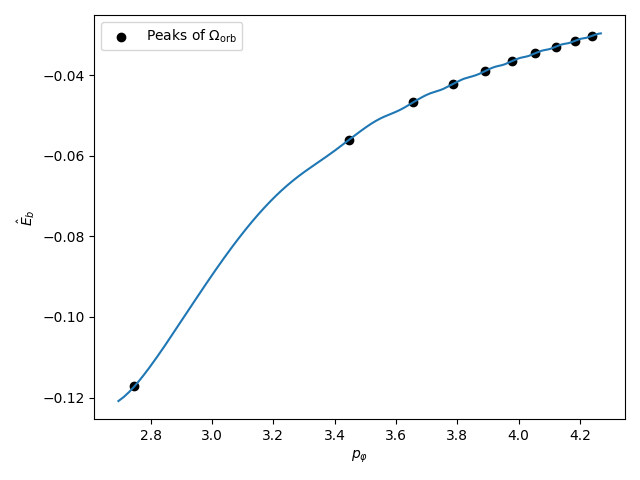
ax.plot(dyn['Pphi'], Eb)
ax.scatter(dyn['Pphi'][pks], Eb[pks], color='k', label=r'Peaks of $\Omega_{\rm orb}$')
ax.set_xlabel(r'$p_\varphi$')
ax.set_ylabel(r'$\hat{E}_b$')
plt.legend()
plt.tight_layout()
plt.savefig('../template/assets/images/eobej.png')
plt.show()